Project Description
Report Description:
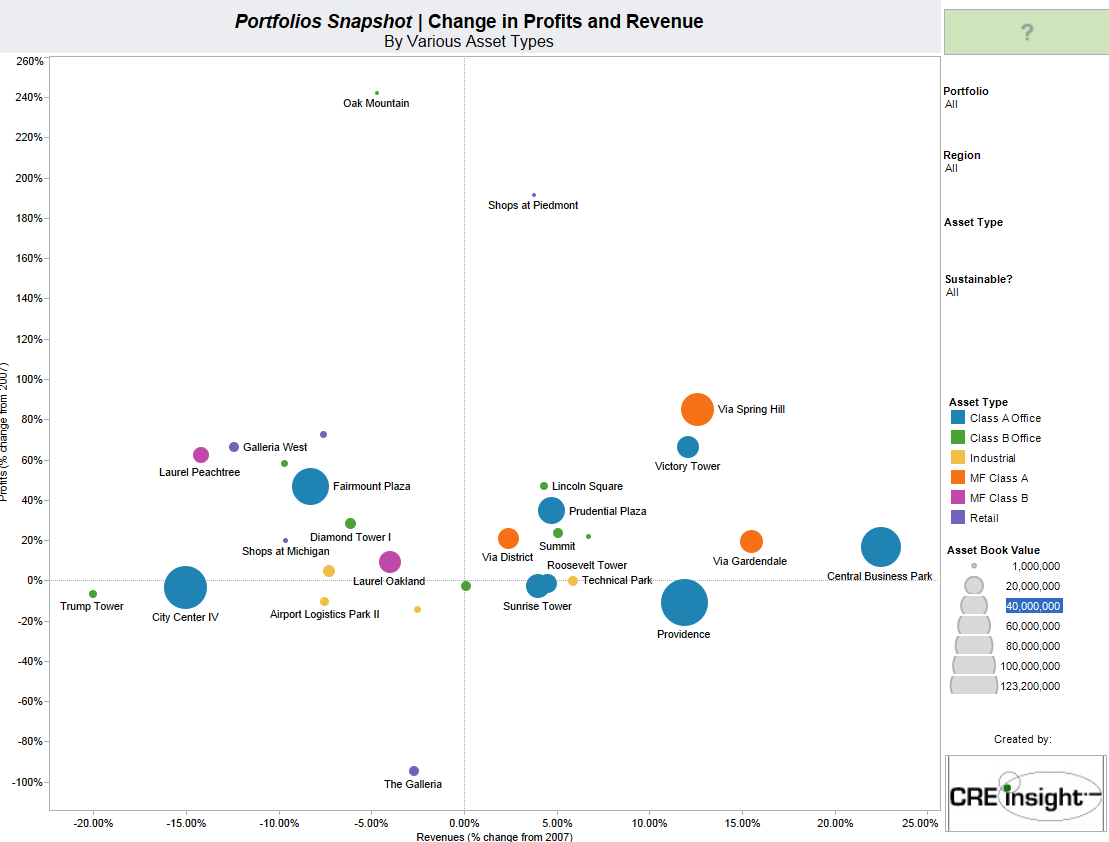
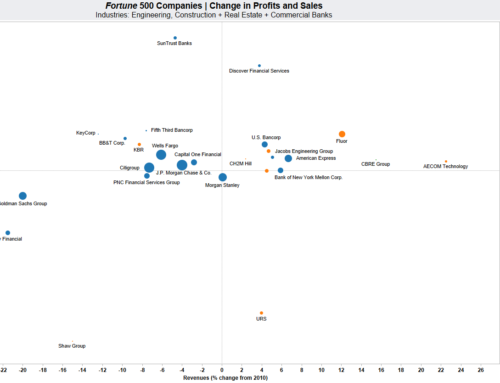
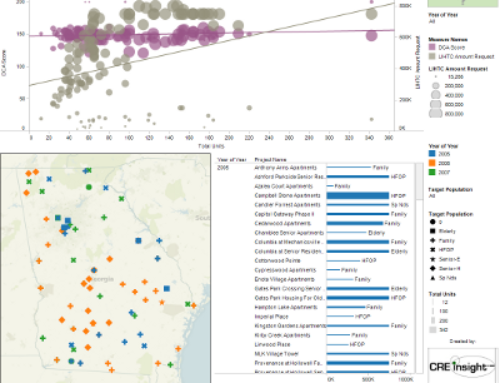
The dashboard is a sample of a portfolio visualization that is allows the user to look at a portfolio across several dimensions. Although fictitious, this format can easily be modified for most situations. The use of various controls on the right allow the user to look at the specific subsets of the portfolio or portfolios.
Key Highlights:
- Portfolio comparisons
- Isolation of particular asset types
- Isolation by region
- Other categories, i.e. sustainability can be viewed within the context of either of the above parameters
The data has already been formatted in informative visualizations including:
- Asset values by type and portfolio
- Median Asset Value per Portfolio, Avg Projected IRR by Asset Type
- Tree Maps used to view Portfolio allocation
- Comparison of Avg. Projected IRR vs % Change in Avg. Revenue sorted by Portfolio
Frequency: Data published as often as client desires
Data Sources:
- Fictional Portfolio Data
Comments:
This is a fictional portfolio visualization that can be modified for your organizations particular needs. Ideally, CRE insight would create a customized report that satisfies the needs of the various groups including internal and external “customers” including fund investors. Please contact us if you would like to know more.

