Project Description
Report Description:
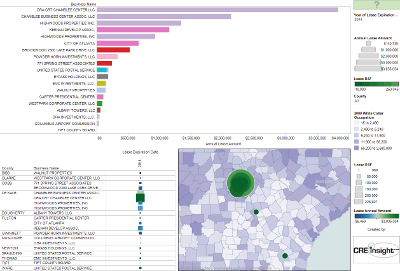
The dashboards and underlying worksheets show GSA properties that are either owned or leased. The data is as of August 2011.
Key Highlights:
Location, Owner / Landlord info
Annual Lease Amount by Location
Lease RSF
Lease Effective & Expiration Dates
The data has already been formatted in informative visualizations including:
Annual Lease Amounts sorted in descending order
Map showing all locations by Lease Expiration Year
Live Google Maps ® of location of property.
Underlying county level base maps showing projected change in white color employment
Frequency: Data published Quarterly
Data Sources:
Comments:
This is a subset of data at the national level that provides both GSA leased and owned real estate as of Aug 2011. Additional states or combination of states can be custom built. Please contact us if you would like to know more.

